Syntax Error #12: Browser Extension Debugging
Let's take a look at debugging browser extensions with web-ext.
Exciting things has happened since the last issue. One of my favorite Python podcasts, Python Bytes, featured the newsletter in their 368th episode and that made me a very happy man. To all the new subscribers who joined the newsletter since, a very warm welcome to our debugging corner of the Internet.
On another note, today is a double birthday: I'm turning 36 and this newsletter turns 1 year old. My plans involve eating a cake and getting together with the family to spend some quality time with them. Your plans, hopefully, include reading this newsletter and learning about debugging your browser extensions. If you want to give me a birthday present, tell someone about this newsletter.
Are you a user who runs their browser clean and as it came from the factory or one of those people like me who loves to customize them? The browser ecosystem and the extension market is close to my heart as I've built a few extensions myself and used to work in Mozilla's Firefox add-ons team, helping developers build extensions.
That's why we are looking at some tools and approaches to debugging them in this month's Syntax Error.
Development & debugging made easier with web-ext
Dear reader, meet web-ext. It's an open source command-line tool that helps extension developers run their extensions way nicer, offers linting for debugging some issues and provides tools to test and debug with variety of browsers.
Debugging extensions in different browsers
web-ext makes it easy to develop and debug extensions cross-platform. With it's --target flag, you can specify if you want to run your extension in Firefox desktop, Firefox mobile or Chromium.
When developing for Chromium, you can combine it with --chromium-binary to specify which browser instance (for example, Google Chrome, Edge, Arc and so on) to run it on.
When developing for Firefox, you can combine it with --firefox flag to specify which version (Beta, Release, etc) you want to run it with.
And if your extension only runs on or encounters problems in specific pages, you can use --start-url flag to start it directly to a specific website – or multiple of them in different tabs.
Read the logs and errors
Extensions have different parts in them and one of the things that can confuse a new developer is that if you run console.log in content script, it logs to a different place than if you run it in a background script or service worker.
When debugging issues, there are a few places to go to.
In Firefox, there's Browser Console (accessible either via Tools -> Browser Tools -> Browser Console or with web-ext run --browser-console) where you can gather the output of all processes into one. That way, you don't need to know where your script will output errors, warnings and logs and only need to follow that one. It's important to note that this is different from the regular Developer Tools Console.
In Chrome and other Chromium-based browsers, content scripts log to the regular developer console (View -> Developer -> Javascript Console) and service worker logs you can find from the same Developer Tools pane but inside the Application -> Service Workers tab. You can also find your extension's Service Worker link through chrome://extensions.
Lint your manifest file
The first step an extension developer needs to take to make their extension runnable in a browser is to make it fit the provided spec. The manifest.json blueprint needs to be correct and the files defined there need to exist in right places.
By running web-ext lint, the linter checks a few rules and reports of any problems.
For this example, I wrote a tiny manifest file with a missing field:
{
  "manifest_version": 2,
  "name": "TestAddon",
  "description": "Test"
}
1.1 Incorrect manifest.json file
And the linter offers us this (I reformatted it from columns to rows so its more readable in the newsletter):
Validation Summary:

errors          1
notices         0
warnings        0

ERRORS:

Code	    MANIFEST_FIELD_REQUIRED
Message     "/" must have required property 'version'
Description See https://mzl.la/1ZOhoEN (MDN Docs) for more information.
File        manifest.json
1.2 output of web-ext lint
It tells us that we are missing a required property called version and it needs to be in the root of the manifest. What I really like is that it also links to docs for more information.
If we attempt to use a deprecated API, for example having chrome.extension.sendRequest call in our Javascript code, linter will tell you what, where and why:
Validation Summary:

errors          0
notices         0
warnings        1

WARNINGS:

Code		DEPRECATED_API
Message		"extension.sendRequest" is deprecated or unimplemented
Description	This API has been deprecated by Firefox.
File		background-script.js
Line		7
Column		1
1.3 output of web-ext lint
How I use web-ext to test and debug my extension
One of my extensions that I use daily is Pokemon TCG card viewer. It adds the ability for the user to hover over a Pokemon TCG Online/Live deck list and see the images of the cards as a pop up.
It's a very visual extension and relies on 3rd party API. I created a visual testing environment that works a double duty: it helps me double check that the old special cases are still referring to the correct images from the API and it gives me a controlled environment to test changes and new features.
I have a Makefile target:
test-visual:
	cd tests/ && npm install && node_modules/.bin/http-server -p 9000 & web-ext run --bc --start-url localhost:9000 & wait
When I run make test-visual, it installs required npm packages and starts up a http server in the test folder. Parallel with that, it runs web-ext with flags to open the Browser Console for degugging and opens the browser to localhost:9000 which is where the test site is served at.
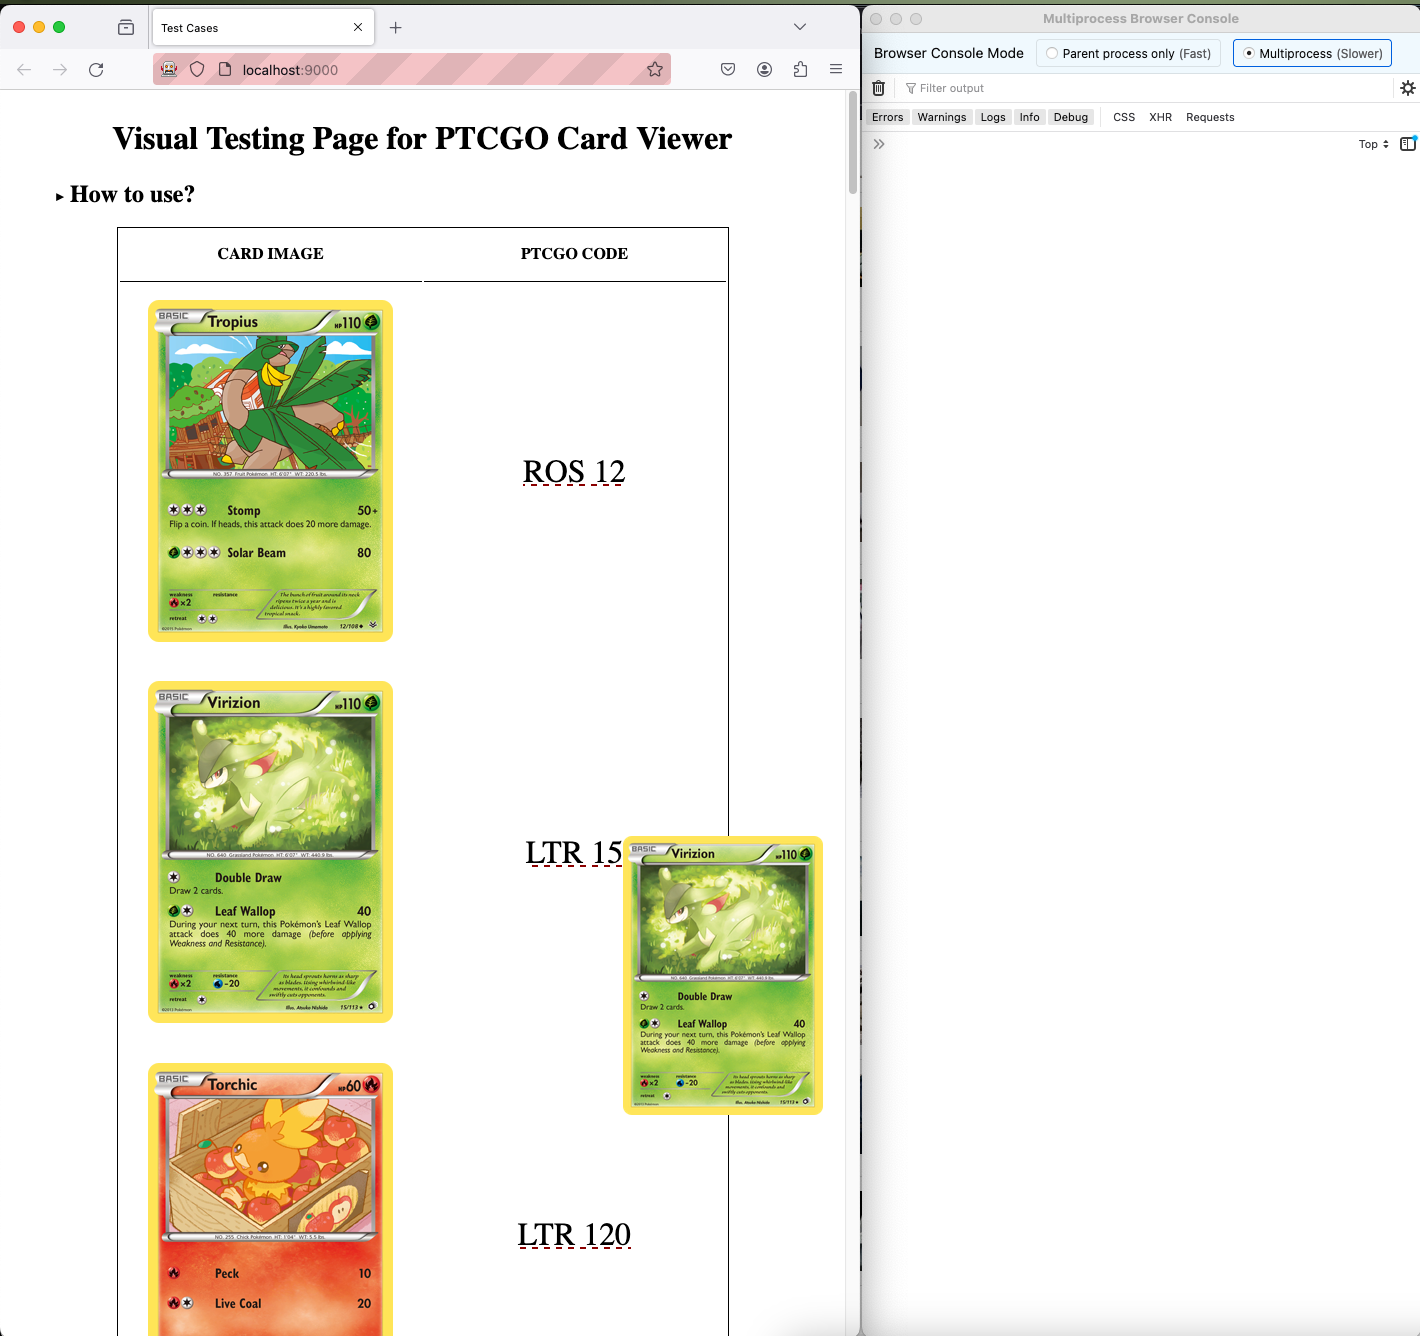
With this setup, I have all the errors and debugging console.logs available on the right window and on the left, I have a manually set example image and its corresponding code that I can hover over.
With this setup, I can test that it works and I can double check that every image on hover matches the hand-picked one on the left.
Once I've tested it with this, I can navigate to websites I know have these deck lists to double check that my selectors find the elements correctly.
Right now, my extension is only available for Firefox but if I was to build one for Chromium based browsers as well, I could open it in multiple different browsers at the same time and test it out all the same.
Story time
Since we're in the browser space, let's take a look at how Dennis Schubert approached debugging a web compatibility issue on Firefox Nightly.
The initial bug reported that a page did not load at all on a specific version of Firefox. Dennis embarked on a journey to figure out what was happening and I love his detailed report on the GitHub issue.
I recorded a profile, and it looks like the site spends all of its JS runtime inside a function called b.prototype.modPow, where the function names decrypt and setCookie appear in the stack. So it somehow sounds like it's trying to decrypt a cookie, and failing at that?
He then explains what he noticed happening and eventually landed on
I captured the responses for the aforementioned "blank"-with-JS page in the Last Good and First Bad builds. they're mostly the same, but there are two very obvious differences:
- the payload for the.setPrivateKey()call is 812 chars of base64 for the Last Good build, but 12348 chars for First Bad
- the payload for the.decrypt()call is 172 chars for Last Good, but 2732 chars for First Bad
so that would certainly explain why the operations take so much longer in First Bad.
... but why?
The entire debugging process had a little bit of everything: using debugging tools (like Firefox Profiler) to see what's happening, comparing cookies set, following the path of breadcrumbs found and plain searching stuff from Google. The only thing missing for a perfect story is talking to ducks.
Syntax Error is created with love by Juhis. If you liked it, why not share it with a friend? Or if you have any feedback or just want to say hi, hit reply. I'm always happy to hear from my readers and learn about what you do and how you debug your issues.