Syntax Error #5: Python breakpoints
This month we look at debuggers in Python and how to choose your own debugger instead of relying on the built-in pdb.
After a summer break in June, we're back in the world of ducks and debugging.
Thank you being a subscriber and reading this. Whether it arrives to your email or your RSS feed, I'm very happy that you decided to give my newsletter your time and focus in this world that is full of everything to do. I hope you are having a brilliant day. ❤️
Debugging with Python's breakpoint()
In the 2nd issue of Syntax Error, I wrote about how printing is a great first step in debugging but it's not always enough. Sometimes you need a better access with a way to step through the execution of a program and the ability to see the values of variables while developing.
Since Python 3.7, we've been able to trigger a debugger with a call to breakpoint(). It halts the execution and provides you with access to The Python Debugger (pdb). With it, you can execute Python expressions like in REPL but in addition, you can walk forward and backwards in the execution of the program.
Knowing how to use debuggers in your language is a very valuable skill. It lets you make less guesses and more well informed decisions as you can find out exactly where the issues arise in your code.
The default built-in Python Debugger pdb can be helpful but it's also simplistic and may be sometimes difficult to follow a more complex piece of code with it.
PYTHONBREAKPOINT environment value
Last week, as I was preparing a new talk about debugging, I learned about an environment value PYTHONBREAKPOINT that you can define to control the breakpoints more.
By defining the value to 0, no debugger will trigger and Python will simply ignore the breakpoint() calls.
You can also define which debugger you want to use by setting the value to a [module].[function]. It gets then imported and executed.
For example, by setting it to ipdb.set_trace, it will open the iPython Debugger.
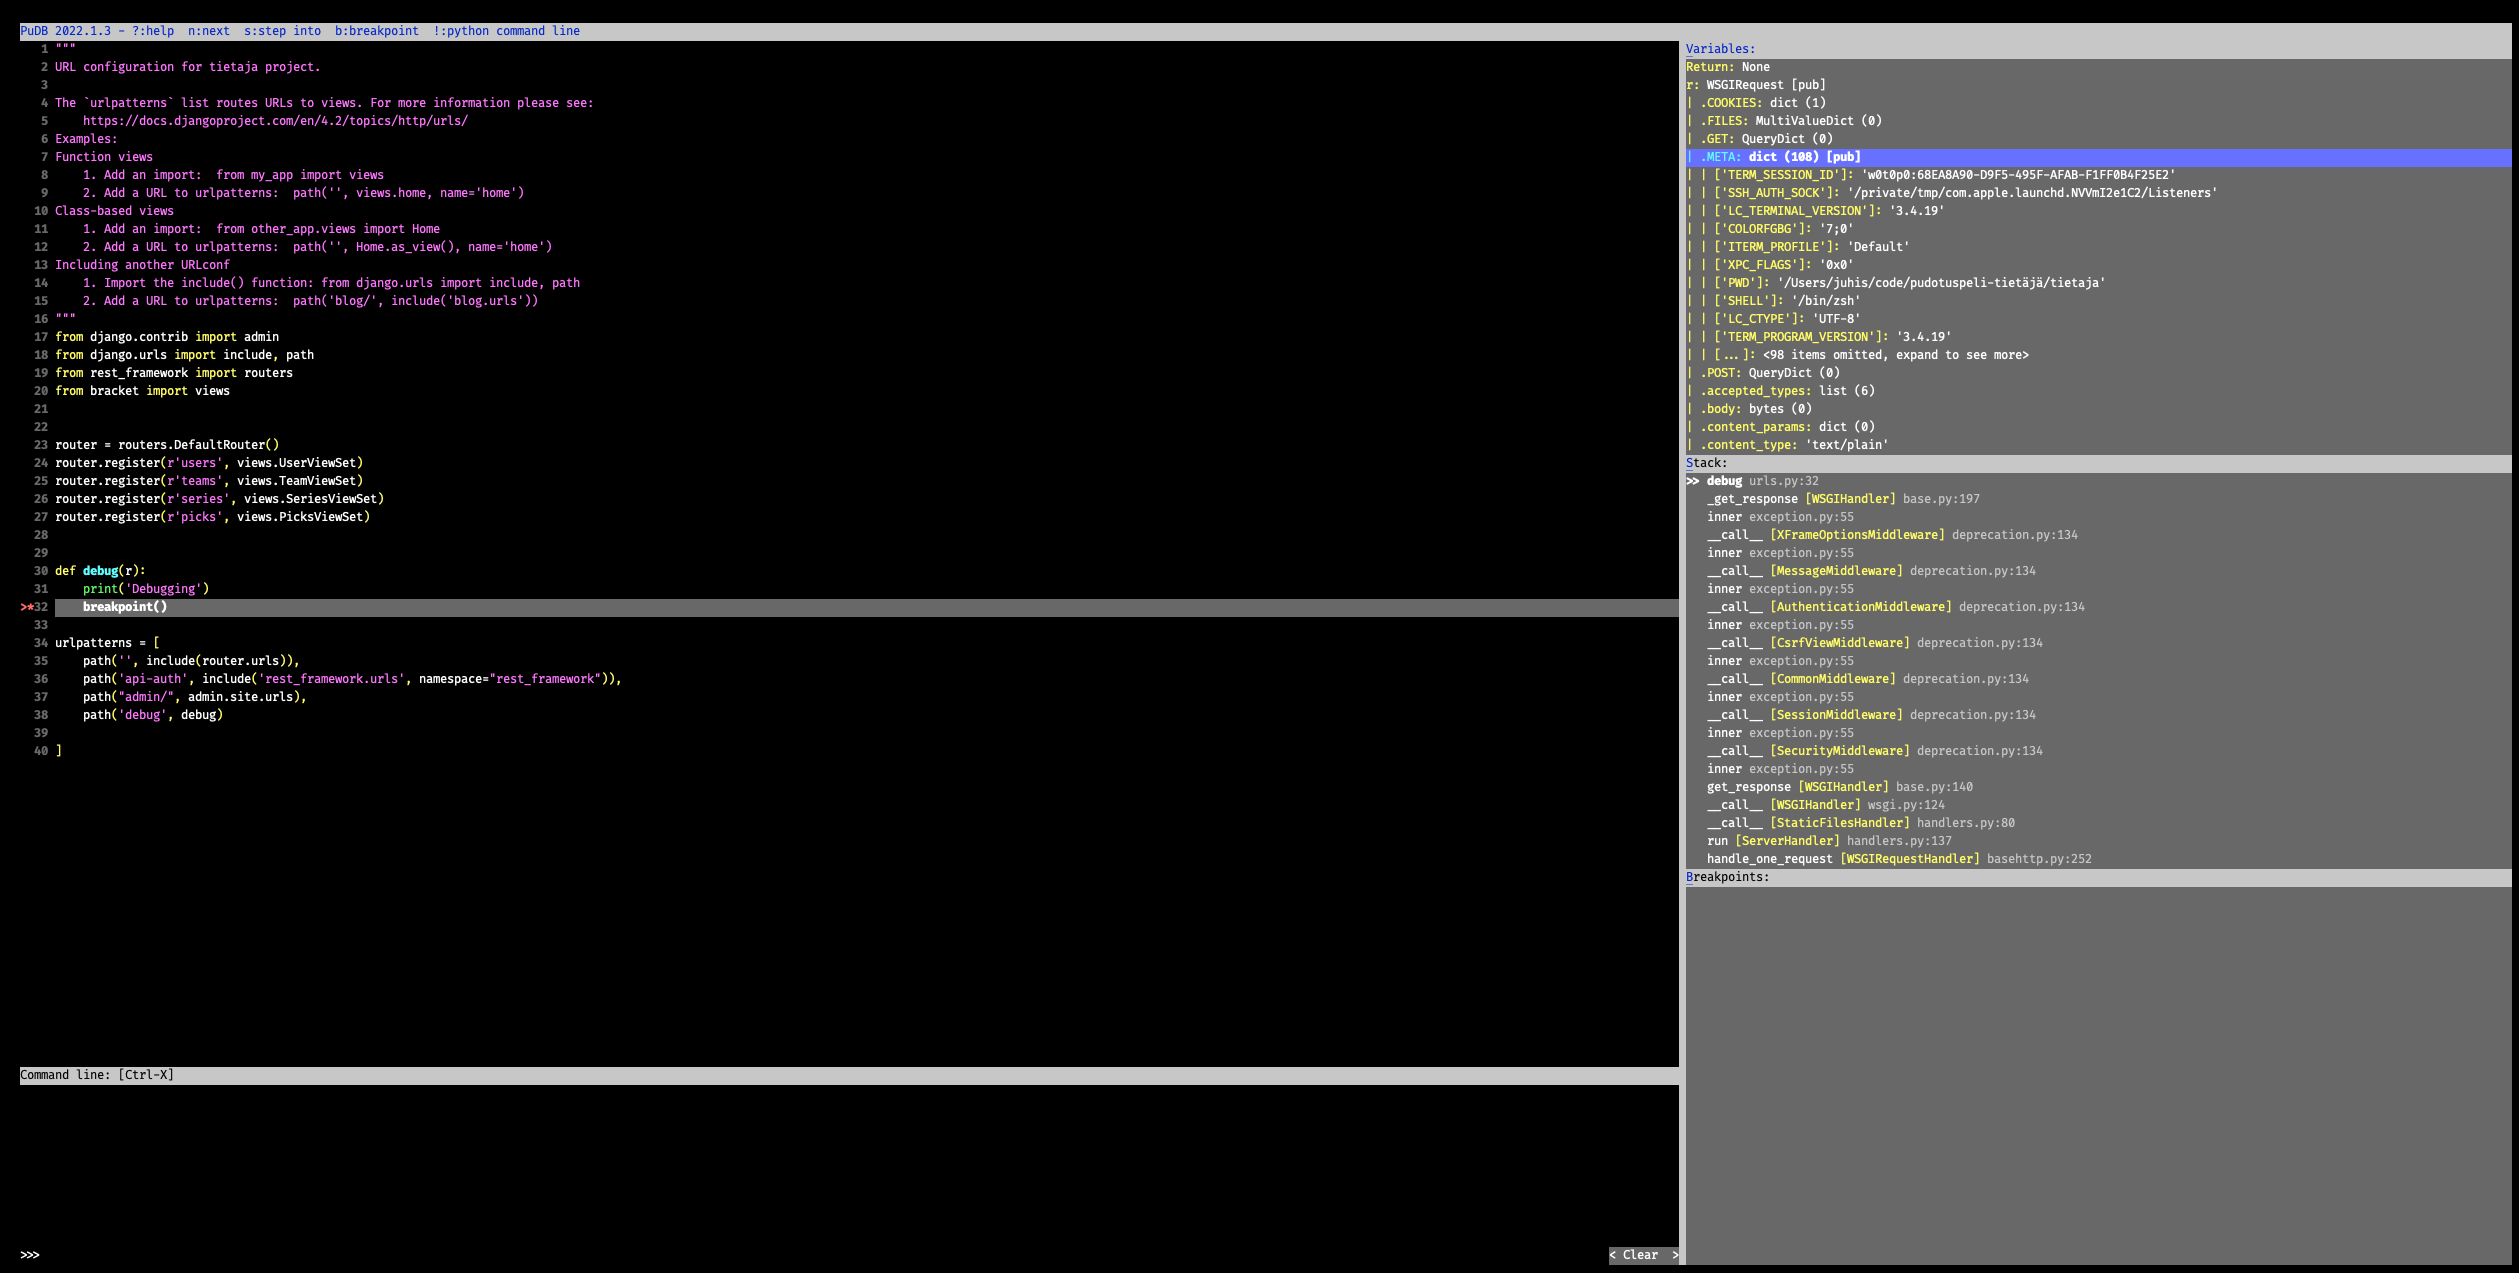
One new debugger I learned about is PuDB that can be invoked with pudb.set_trace. It provides a multi-pane command line interface that shows you the code, the local variables, current stack and lets you set more breakpoints from within the editor view.
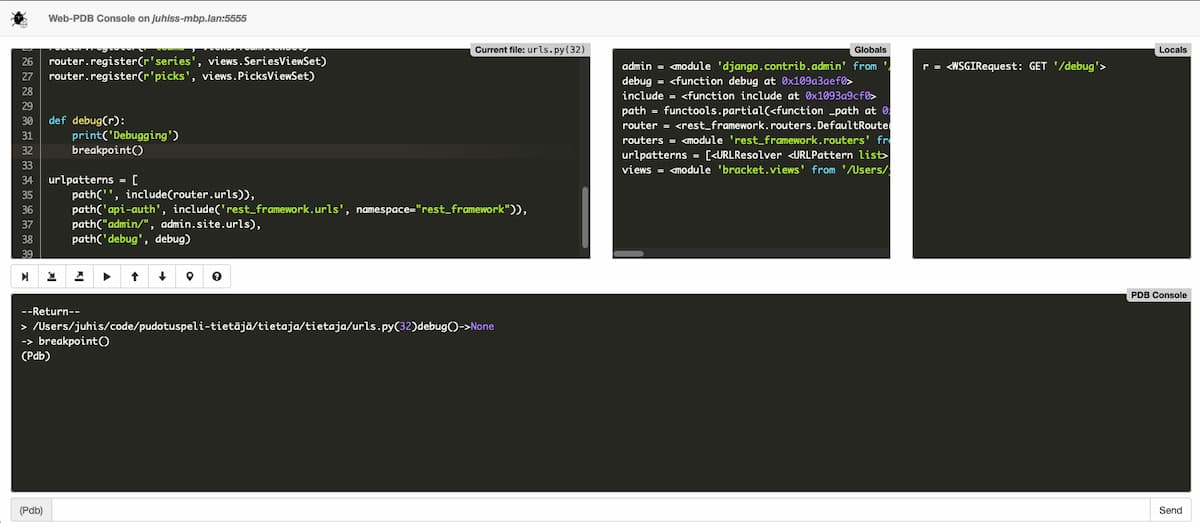
If navigating the command line tool isn't your cup of tea, web-pdb sets up a local web server to which you can connect with your browser for a web based UI. It offers similar functions as PuDB.
Story time
If you have debugging stories or examples you want to share to the Syntax Error community, please reach out via hello@syntaxerror.tech and we might share your story!
This one is less of a story and more of a great look into debuggers that a reader sent my way.
It's called What a good debugger can do?, written by Andy Hippo. Andy has also a few other great debugging blog posts that I recommend giving a read if you want to improve your skills.
I agree with Andy's conclusion:
Every existing debugger has its ups and downs; there’s no silver bullet, but you already knew that. In some situations logging is more convenient, while in others using a time-traveling debugger can shorten the bug investigation from days to minutes. Debugging technologies have come a long way and even though many things are not as impressive as you might expect, there are a lot of interesting features that are definitely worth checking out. Please use debuggers and complain if something is not working. Demand better from your local debugger vendor, only then will things improve.
Syntax Error is created with love by Juhis. If you liked it, why not share it with a friend? Or if you have any feedback or just want to say hi, hit reply. I'm always happy to hear from my readers and learn about what you do and how you debug your issues.