Syntax Error #6: Debugging CSS
This month we dive into debugging tips and tools for CSS.
Happy August debuggers! Another month has passed and hopefully you've had a bit easier time with bugs than usual or even had the opportunity to take some time off from development to touch the grass.
This month's newsletter is all about CSS. Due to its nature, debugging it asks for a slightly different approach than other forms of programming. So let's get started!
Bring in your debug.css
First thing I like to do to set up is to have a debug.css file with selectors like:
[debug] {

}
The [debug] syntax looks for any element that has an attribute debug set. Normally, you are likely not to have any so it won't interfere with the actual code but it enables you to debug individual elements or entire layouts by opening up your browser's Dev Tools and manually adding debug to any element:
<p debug>
    This is now being targeted by `[debug]` selector
</p>
Debug your box model
CSS operates on a box model. No matter how fancy styles we apply to make it look like it might not, web we interact with through browsers is built with boxes on top of other boxes.
These boxes are invisible to the regular website viewer but with debug, we can make them visible.
By adding a red border around every element inside the one with [debug], we can make it more visual to us what's happening:
[debug],
[debug] * {
    outline: 1px solid red;
}
Using outline instead of border makes sure the debug borders don't cause extra shifting of elements as it would otherwise add 2px to height and width of every element it is applied to.
Here's an example of this being applied to Syntax Error front page's body element:
If you want to get more in-depth with this topic, Stephanie Eckles has a great article in Smashing Magazine focusing on layout and overflow issues.
Matija has built a nice bookmarklet that applies this kind of debug outline to body element on any website.
DevTools offer a helping hand
For any web developer, learning the browser's developer tools in-depth is time well spent. For CSS, they offer many great inspection and manipulation tools.
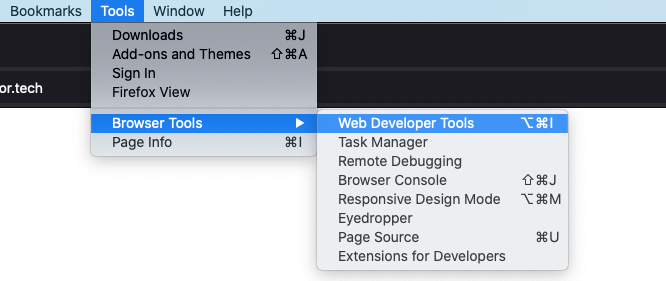
To open them in Firefox, you can go to Tools -> Browser Tools -> Web Developer Tools or use the keyboard shortcut Alt+Command+i (on Mac) or Alt+Control+i (on Windows).
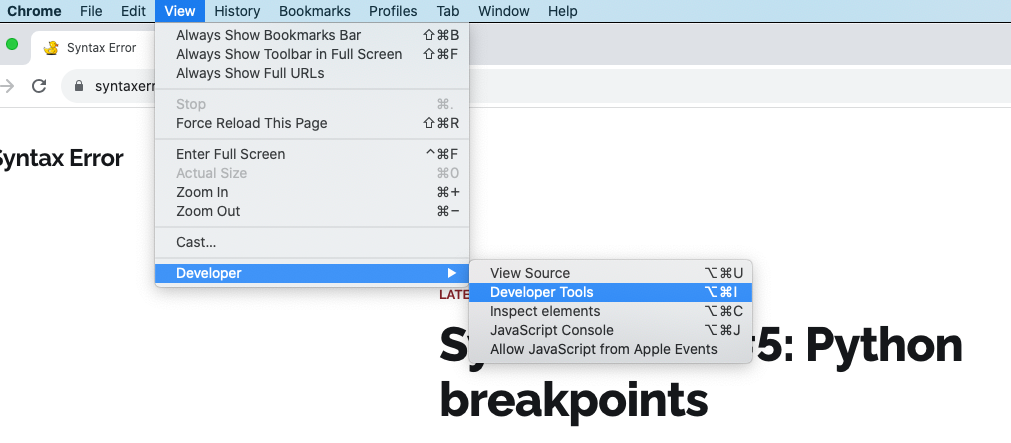
In Chrome, you need to navigate View -> Developer -> Developer Tools or with the same keyboard shortcuts as with Firefox.
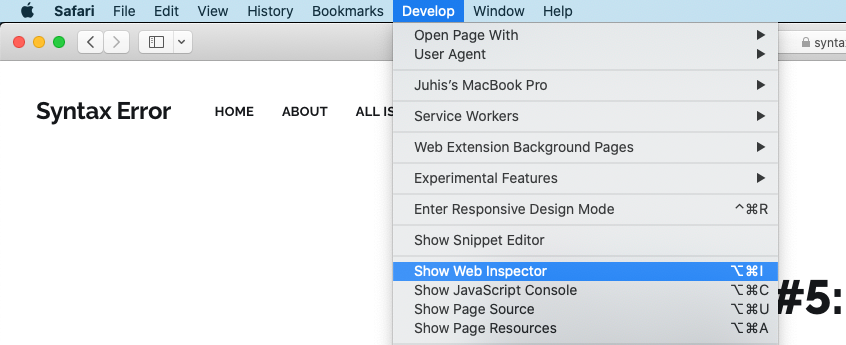
In Safari, you first need to enable Develop menu from settings after which you can find it from the menu as Develop -> Show Web Inspector. Keyboard shortcuts the same as with Firefox and Chrome.
Each browser has a bit of their own specialities but most of the functionality is the same.
To debug CSS, you need to navigate to Inspector (Firefox) or Elements (Chrome/Safari) tab. On the left, you'll see the DOM and on the right, the current styles being applied to an element being chosen.
To activate the [debug] mode from previous part, you need to double click on any element on the DOM and write debug to an empty field. Usually tapping TAB key a few times navigates you to an empty attribute slot if the element already has items.
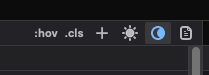
You can also add an ad-hoc debug styling with the Style pane to the right of the DOM pane. With the + button, you'll be able to create new CSS styles, give them selectors you need and then modify the properties.
This ability to adjust CSS styles on the fly, either for current element only, for any existing selector that comes from your CSS files or by creating new ones opens up the doors for so many opportunities to debug CSS.
My workflow even if I don't have any bugs but need to write new CSS to adjust and style elements is to start in the developer tools as that gives me instant feedback in the same window. Here's a few nice extra features:
- Clicking on a color box next to a color definition opens up a color picker and after picking a color, you can copy paste its hex or RGB value to your CSS files
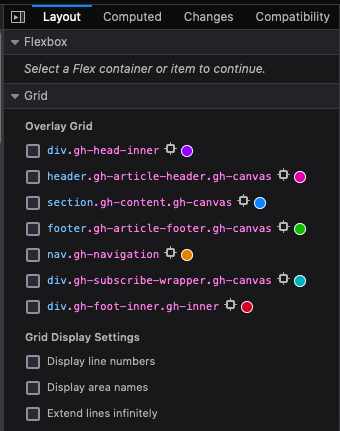
- In Layout tab, you can adjust visibility of grid lines for elements with
display: grid:
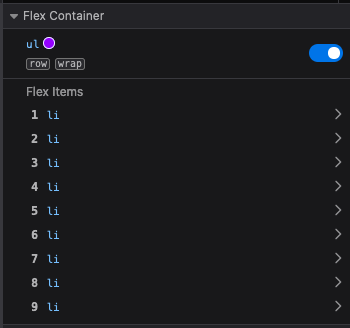
- Similarly for Flexbox, you can toggle area visibility and see the flex items within:
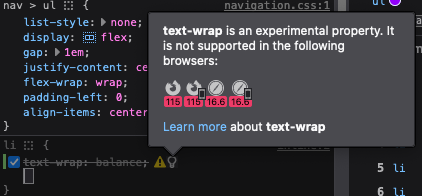
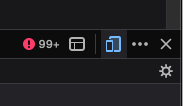
- In Firefox, if you're using CSS properties or values that are not supported across all major browsers, you'll get a lightbulb icon with a tooltip that shows compatibility table and links to documentation. It's a great way to avoid accidentally using unsupported styling without fallbacks.
- In Firefox, you can click on a tiny dotted square next to a selector to highlight every element on the page it is applied to. Handy when you're wondering if styles are being applied correctly.
MDN has good documentation about CSS debugging with Firefox Dev Tools. For Chrome, check out Chrome's documentation.
Debug missing alt text
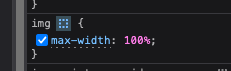
Another powerful debug selector is to select any missing alt texts:
[debug] img:not([alt]),
[debug] img[alt=""] {
    outline: 1px solid blue;
}
I've been using this with my CMS so when I write blog posts, I'm immediately alerted to any images I've added that are still missing alt texts.
Remember that an alt text existing does not yet mean that the alt text is descriptive and good so you should regardless double check your alt texts but I've found this very helpful for accidentally forgotten cases.
Accessibility: Tab order, contrast and prefers- emulation
In Firefox, if you navigate to Accessibility tab in Developer Tools, you can toggle on Show Tabbing Order checkbox
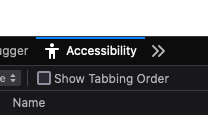
It will add a number next to each element that is tabbable and the number indicates the order in which the elements are being tabbed:
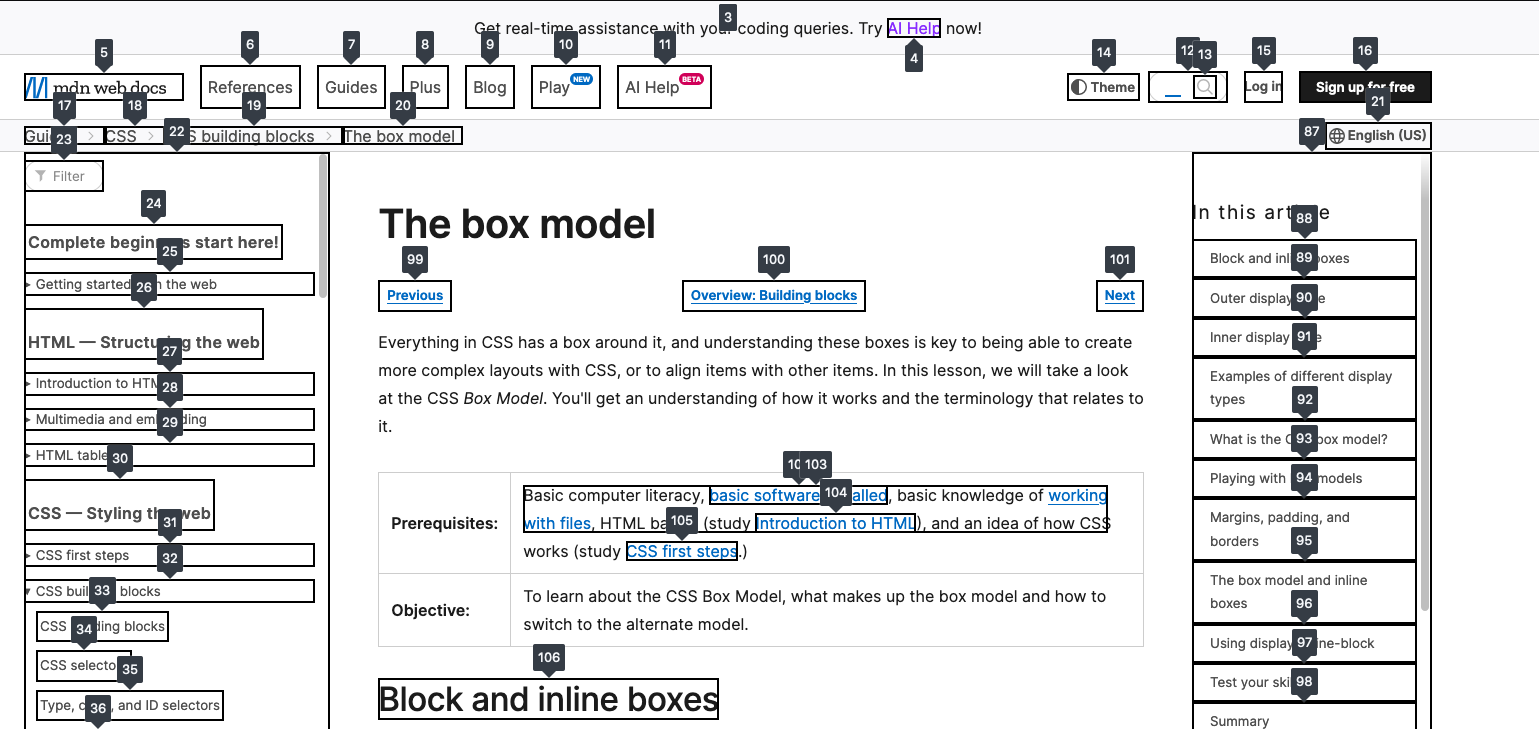
This can expose inconsistencies between your DOM and the visual looks when using something like flex-direction: column-reversed which turns the order of elements visually backwards but does not affect tabbing order.
In the same tab, you can also Check for issues to check for example if there are elements on the site that don't have enough contrast to be accessible.
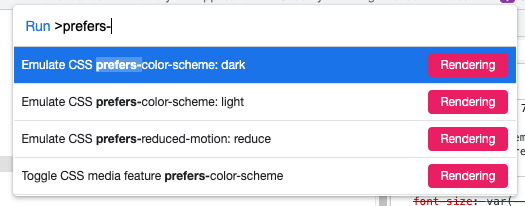
In Chrome, you can emulate different prefers- values. You can open the command menu with Shift-Command-P (Shift-Control-P) when Dev Tools are open and type prefers- to find all the options:
Firefox currently offers emulation for light/dark mode through the CSS pane but not for reduced motion.
Debugging responsiveness
Developer Tools also offer ways to debug your CSS for responsiveness. With Firefox, you can activate Responsive Design Mode either from an icon with phone and tablet or with keyboard shortcut Command+Option+M (Control+Option+M for Win). Chrome calls it Device toolbar and can be activated similarly from their Dev Tools.
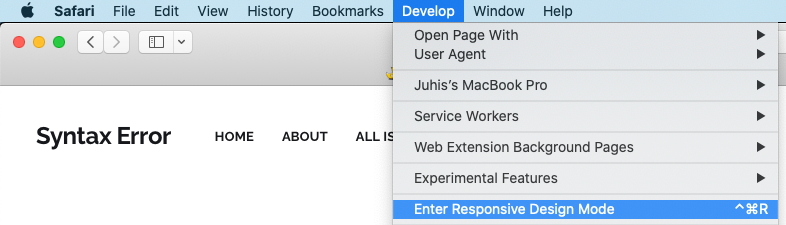
In Safari, you can enable Responsive Design Mode from Develop menu or with keyboard shortcut Control+Command+R.
Inside this responsive mode, you can select from variety of preset sizes for devices or freely change the dimensions of your window to see how elements on your website adjust to different sizes.
Story Time
If you have debugging stories or examples you want to share to the Syntax Error community, please reach out via hello@syntaxerror.tech and we might share your story!
As I was browsing through the Fediverse the other day, I ran into this very nice graph by Forrest Brazeal:
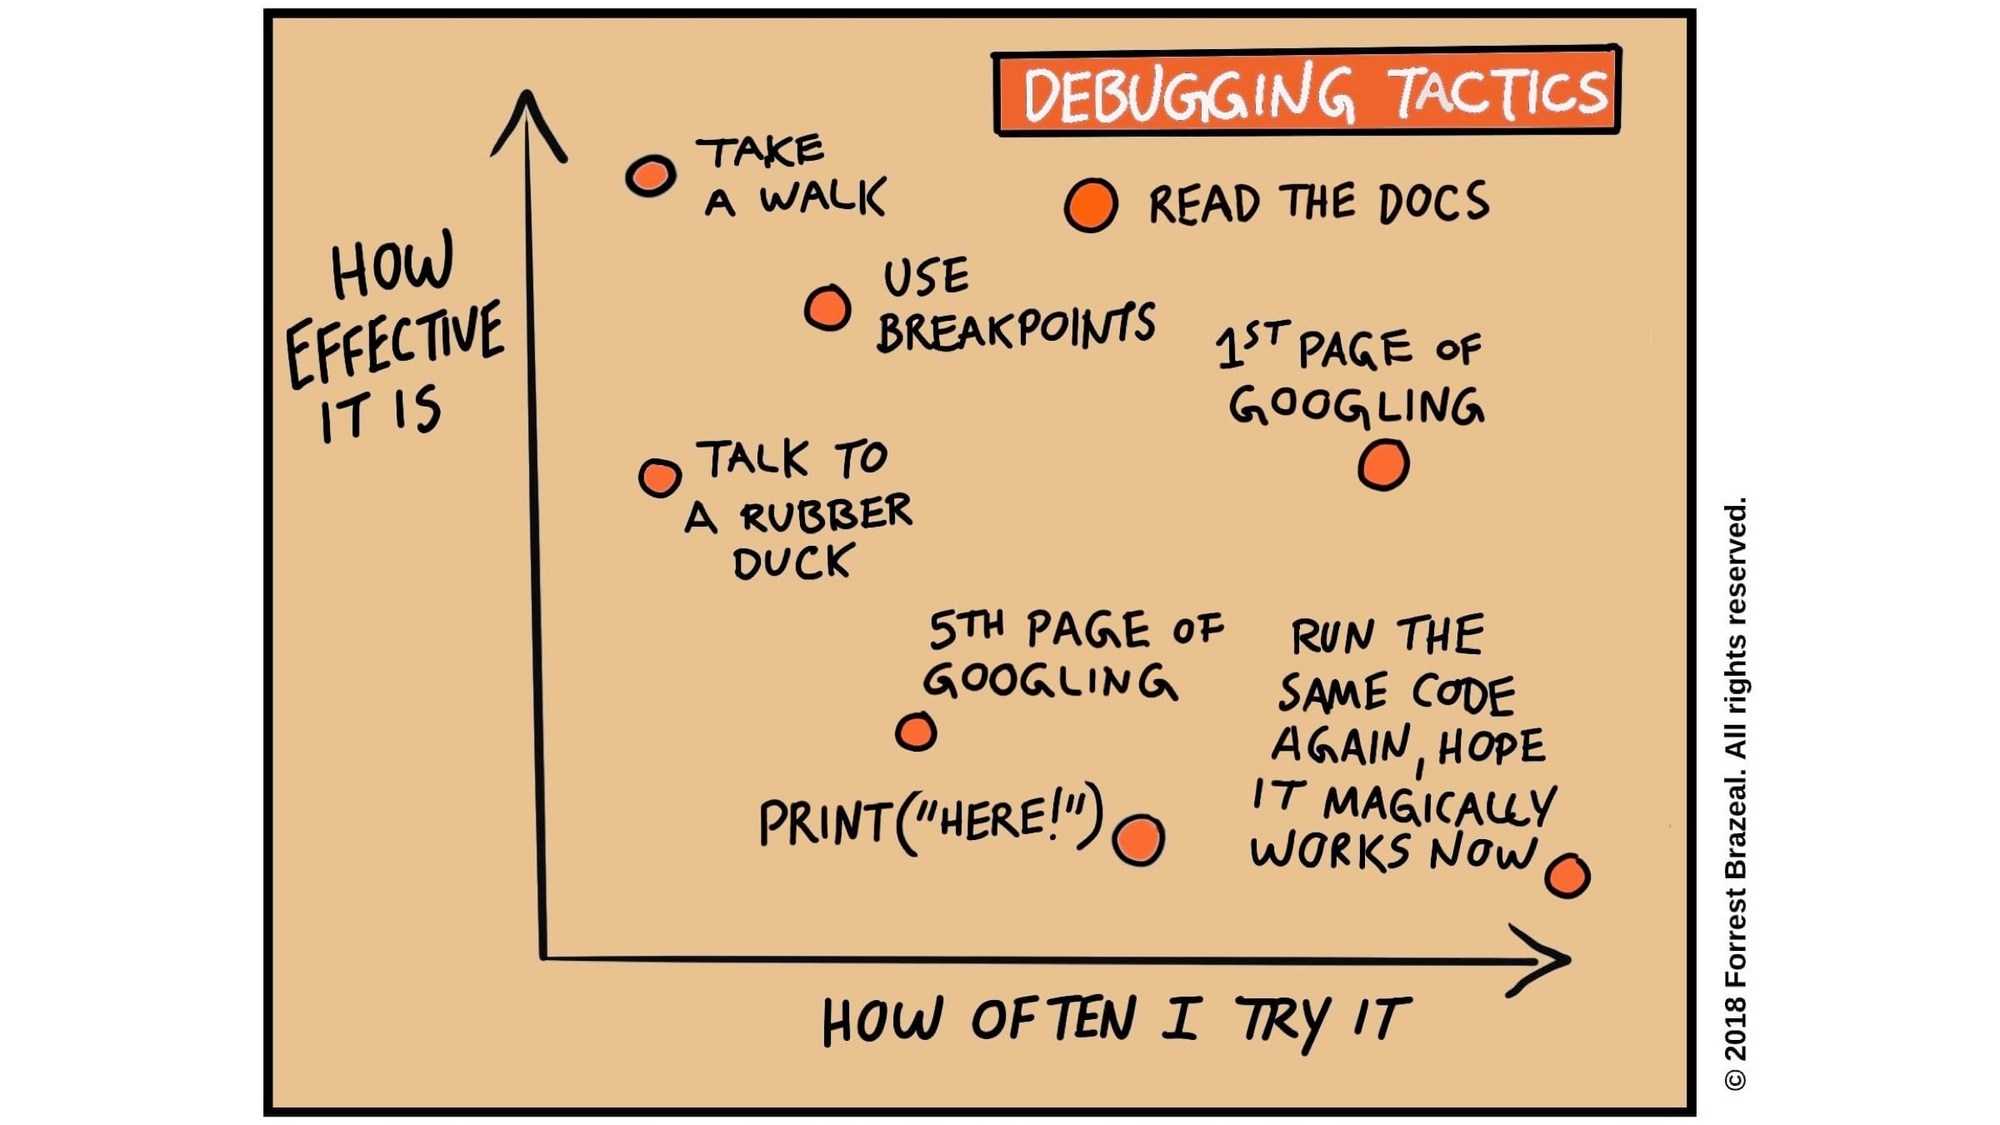
As I originally found it cropped without the credits, I used Google's reverse image search to find the origins and that took me to Addy Osmani's blog post Debugging Tactics.
He was kind enough to put the most important learning right at the top:
When you're debugging a system, the first step is to accept that what you believe about how it works might not be true. If everything were as you believe it to be, then your code would work—but obviously that's not always the case. If you can't accept this, you might find yourself living the old saying 3 hours of debugging can save you 5 minutes of reading the docs.
He writes about a lot of the same tips I've discussed in the previous issues so it's a good extra reading as repetition helps learn!
He finishes the post with a good list of questions that you should keep in mind when debugging:
To debug a problem, first define it and ask yourself questions about it.
What is the goal of the code?
What does the code actually do?
What are the issues you found with the code?
Have you encountered these kinds of issues before?
What did you do to fix them last time?
What do you think caused the bugs?
Before you dive in to the code and start staring at it, next time you encounter a bug, try answering these questions first to ground yourself in the situation and activate your brain to think about the problem at hand.
Syntax Error is created with love by Juhis. If you liked it, why not share it with a friend? Or if you have any feedback or just want to say hi, hit reply. I'm always happy to hear from my readers and learn about what you do and how you debug your issues.